Economic Overview
October, 2022
A brief look at relevant economic indicators in supply chains, packaging and distribution, from your partners at OMNI Systems.
Top-level Economic Indicators
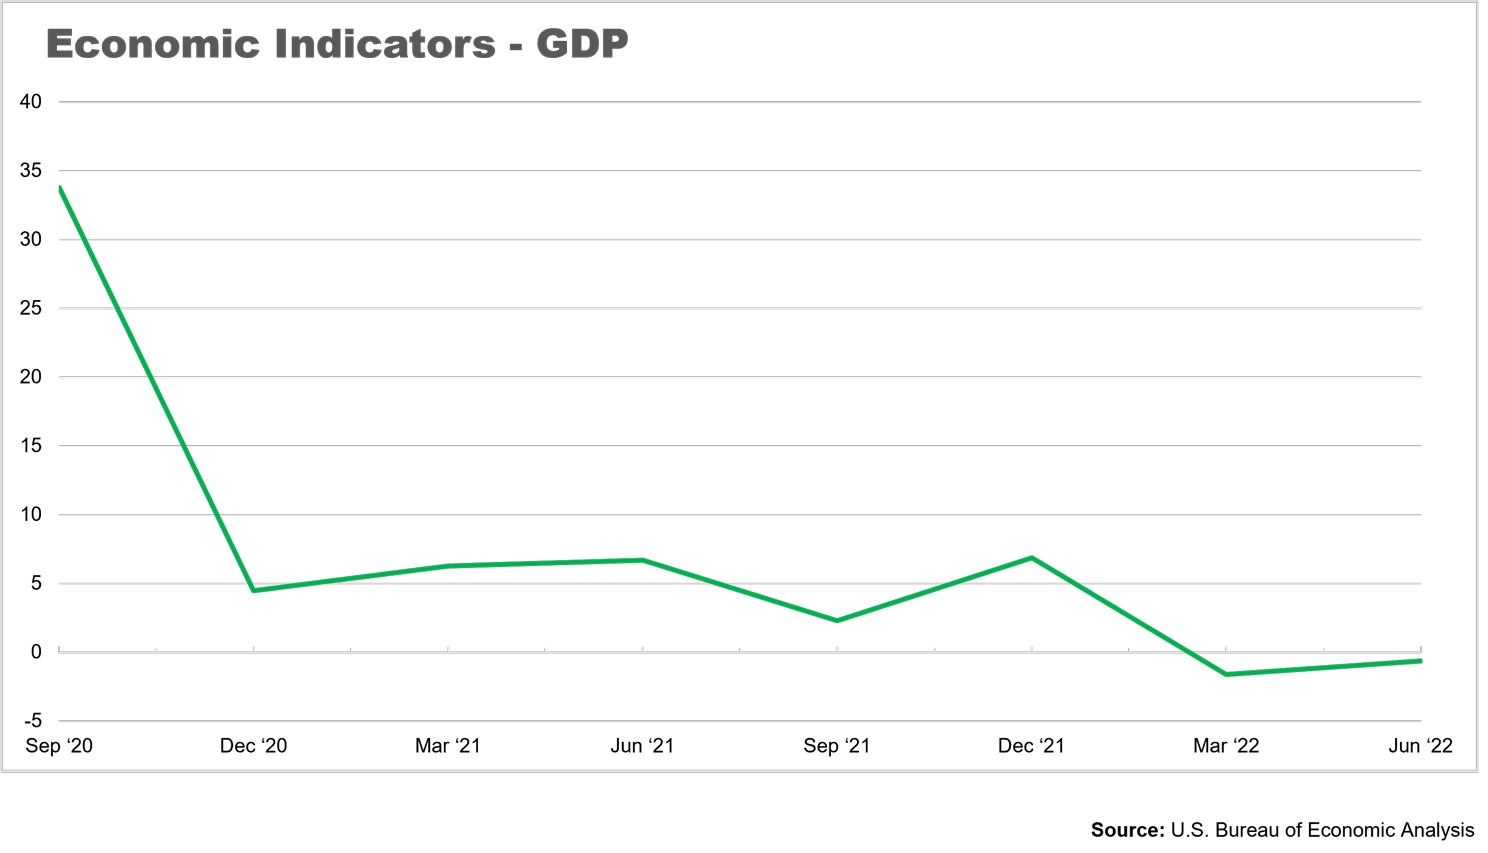
U.S. GDP
This is the annual growth in goods and services produced each month. Three percent growth for a large country is good. Above 5% growth is excellent.
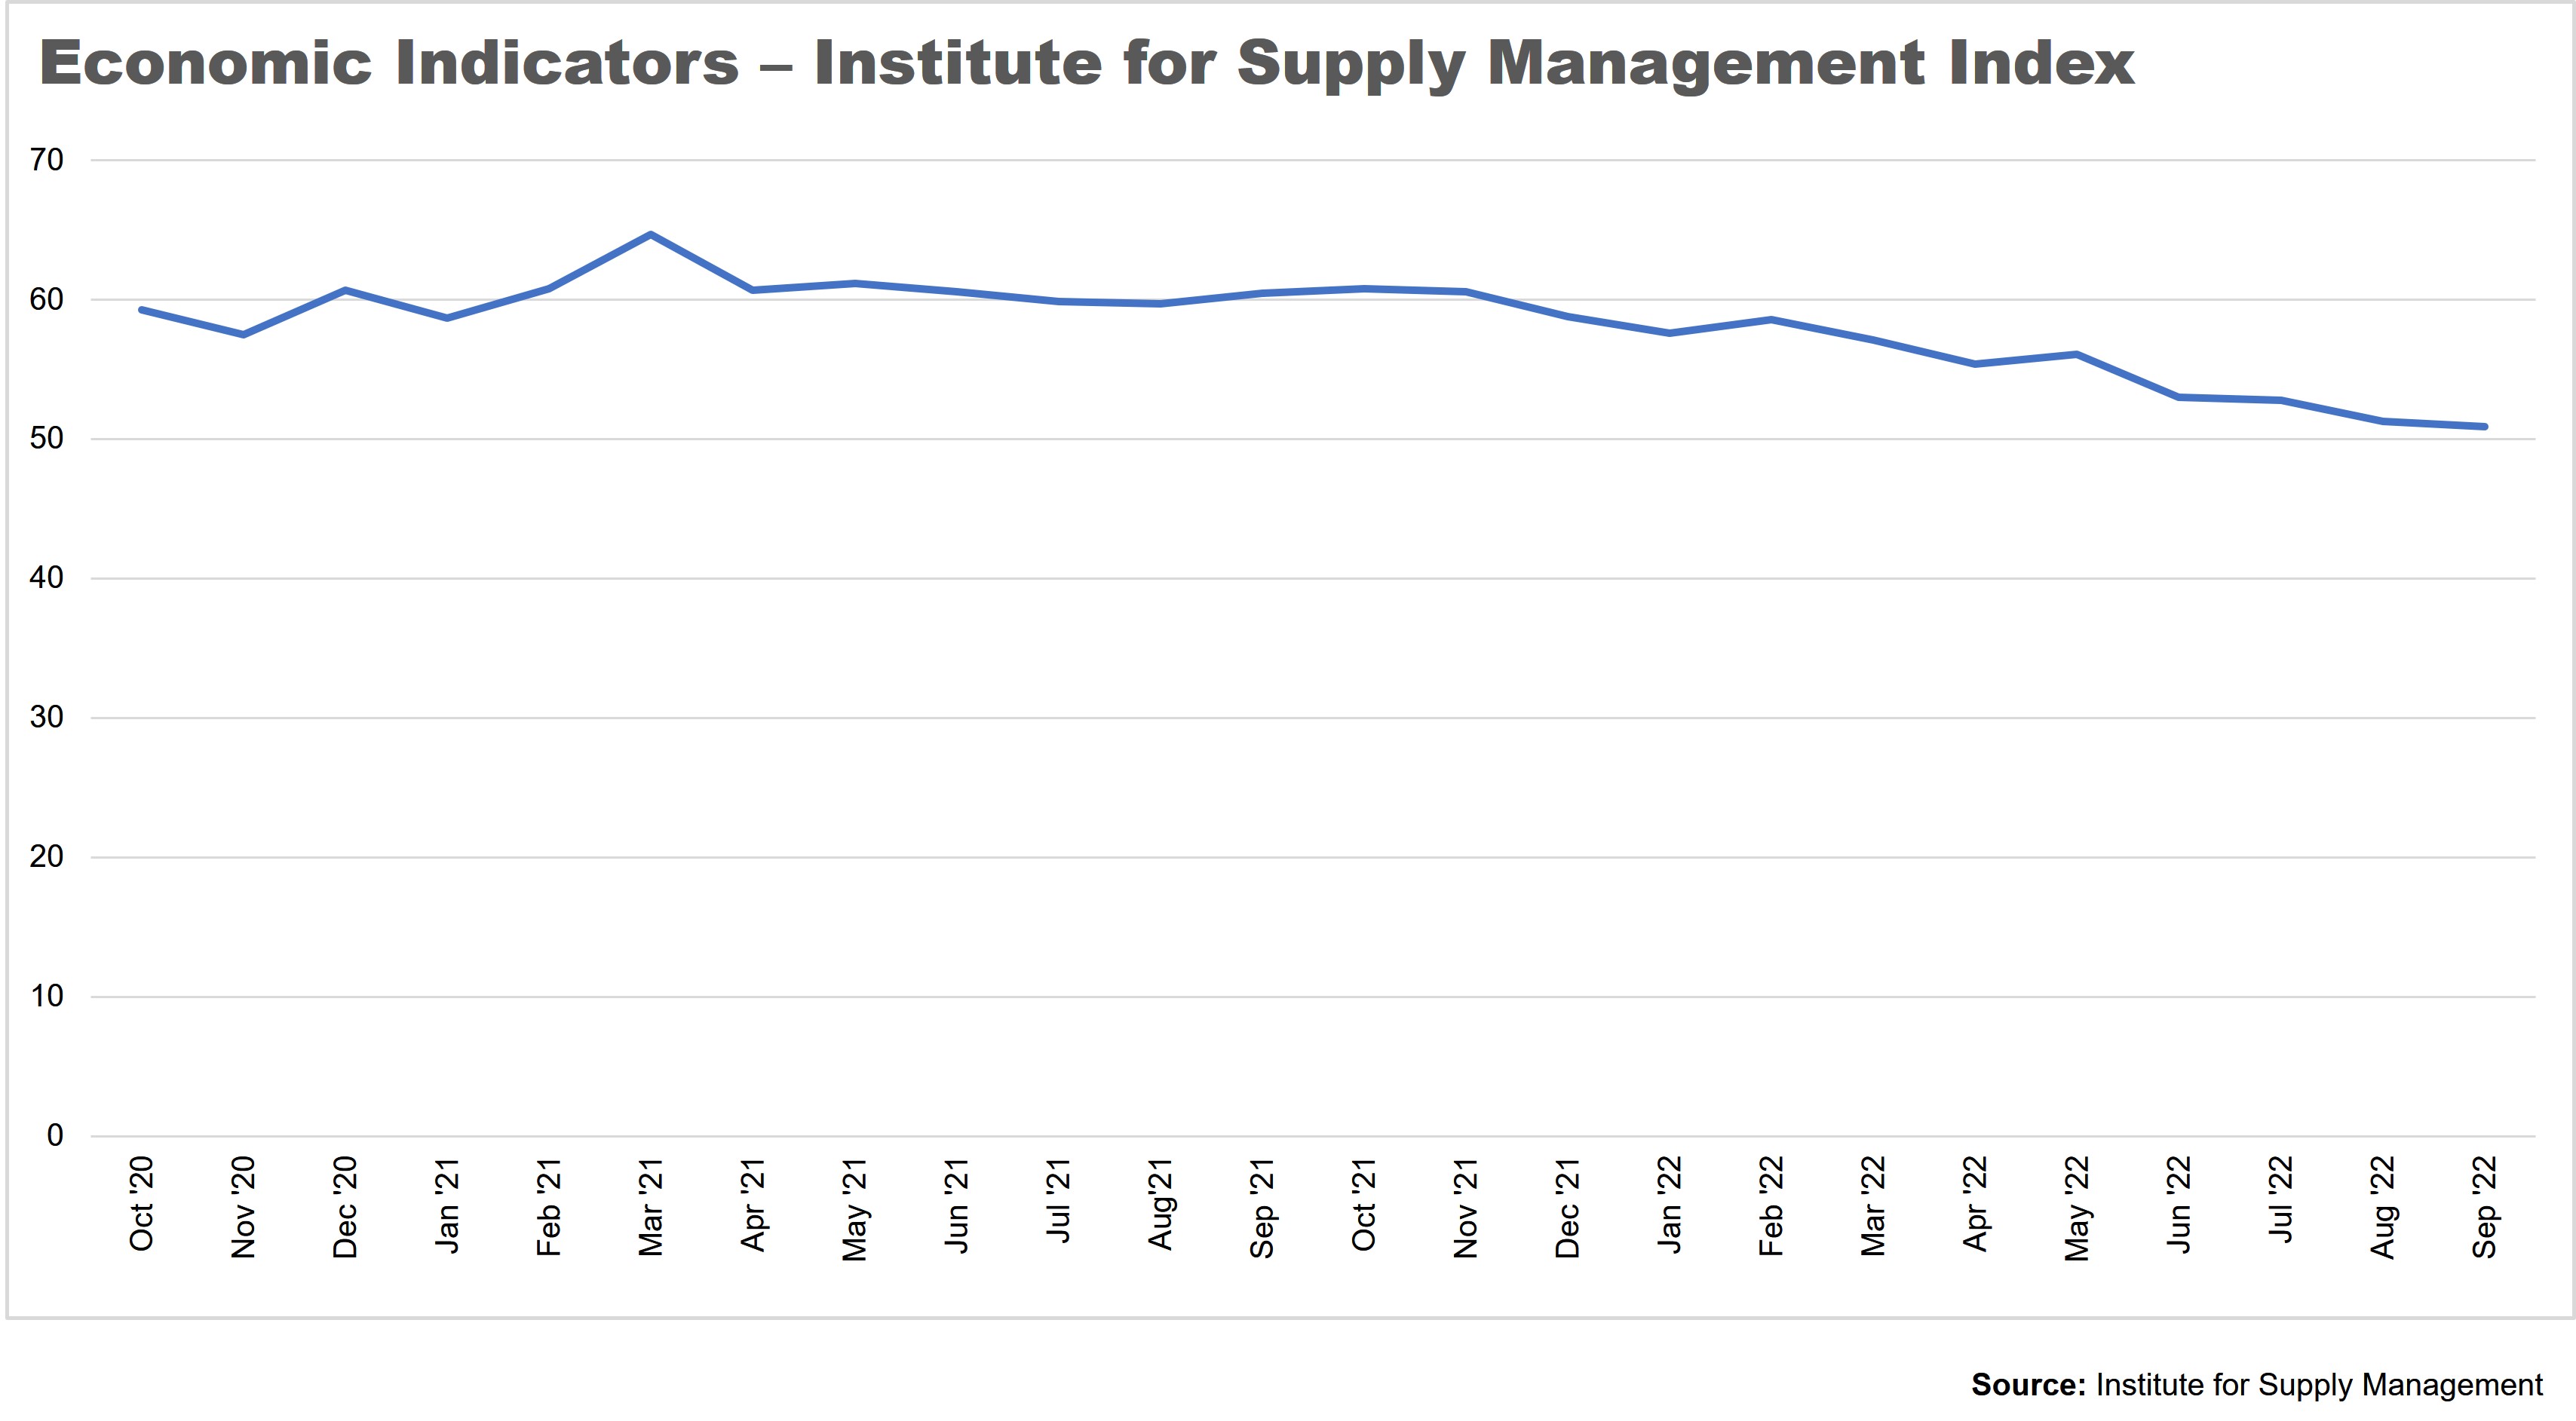
Institute for Supply Management Index
This measures each month the plans of major U.S. companies. Above 50% means that most companies are hiring, spending on Capital Equipment and have lower inventory. Below 50% means that companies are laying off and reducing capital investments.
Source: U.S. Bureau of Economic Analysis
The BEA estimates GDP for each quarter. It’s presented as the percentage of change from the previous quarter, with adjustments to remove the effects of inflation over time—allowing for meaningful comparison between periods.
Source: Institute for Supply Management
ISM’s Manufacturing PMI® (Purchasing Managers Index) measures month-to-month change in new orders, production, employment, deliveries and inventories across the U.S. economy. A level above 50 indicates increased activity from the prior month, and below 50 indicates reduced activity.
U.S. Gross Domestic Product
Real gross domestic product (GDP) decreased at an annual rate of 0.6% in the second quarter of 2022, following a decrease of 1.6% in the previous period.

Q2 results were impacted by decreases in:
- Private inventory investment, led by shrinking retail inventories.
- Residential fixed investment, led by decreases in real estate broker commissions.
- Federal expenditures in non-defense spending, which was partly offset by increased defense spending.
- Local and state government spending, led by cuts in investment in buildings and structures.
Economic sectors with increased activity included:
- Exports, led by industrial supplies and materials; and travel and other services.
- Consumer spending, led by increases in food services and accommodations, and partly offset by a decrease in spending on goods—especially food and beverage.
Source: U.S. Bureau of Economic Analysis
Consumer Price Index
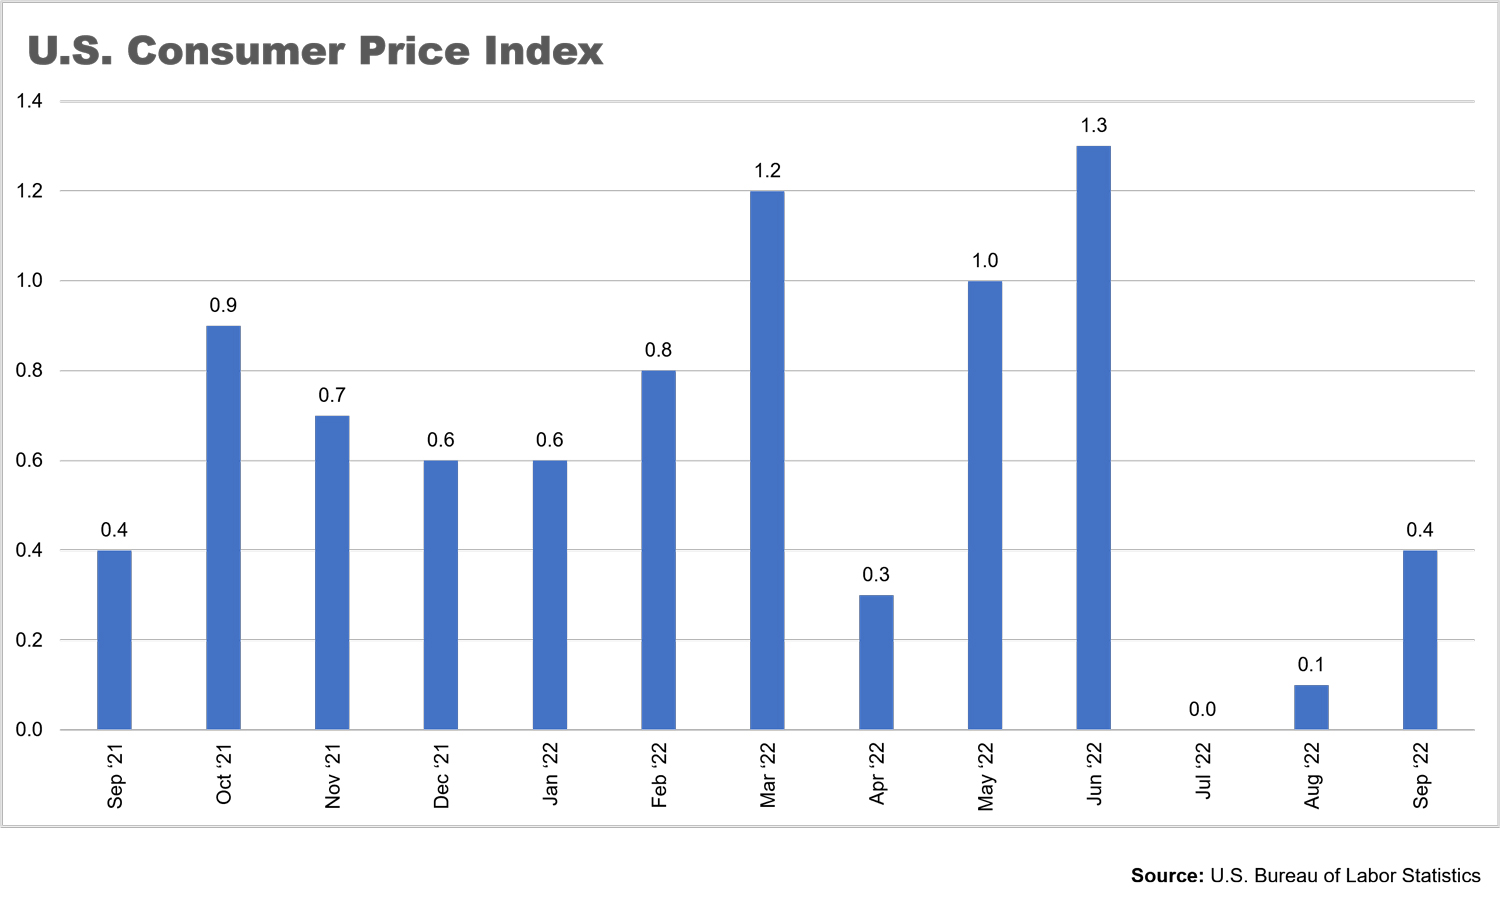
The Consumer Price Index for All Urban Consumers rose 0.4% in September on a seasonally adjusted basis, after rising 0.1% in August, according to the U.S. Bureau of Labor Statistics. Over the last 12 months, the index increased 8.2% before seasonal adjustment. Increases in the indexes for shelter, food and medical care were the largest of many contributors to the monthly seasonally adjusted all-items increase. These increases were partly offset by a 4.9% decline in the gasoline index.
Month-to-month percentage change in the Consumer Price Index, seasonally adjusted.
Source: U.S. Bureau of Labor Statistics
Annual Inflation Rate
The annual inflation rate slowed for the third consecutive month, to 8.2% in September. While it was above the forecasted 8.1%, it was slightly lower than August’s 8.3% and was the lowest level in seven months.
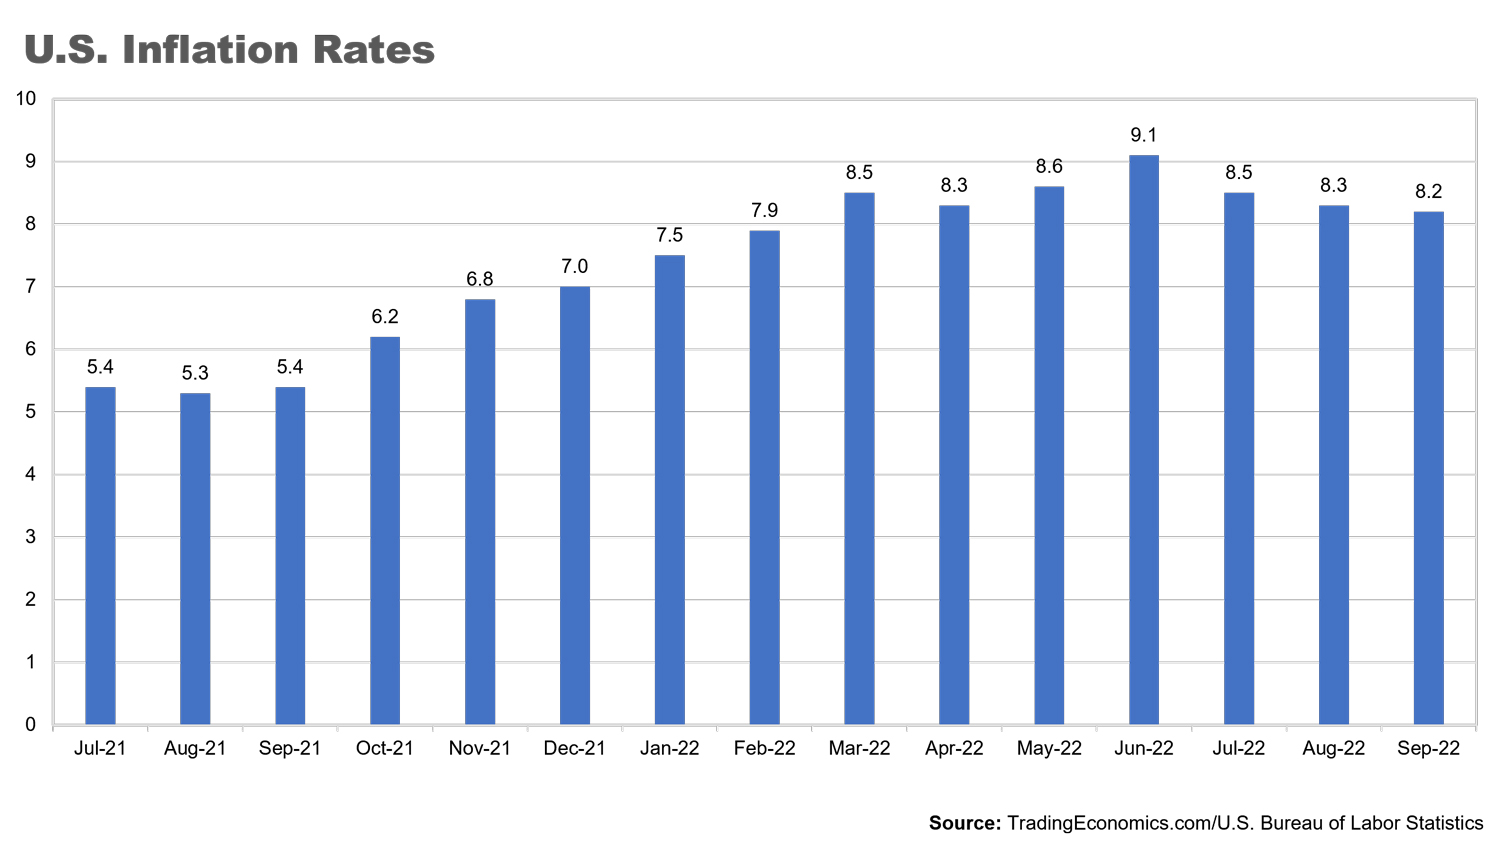
- Energy costs increased 19.8%, led by gasoline, fuel oil and electricity—although increases for each of these commodities slowed from previous months.
- Food costs showed a slight slowing in the rate of increase, to 11.2% compared to 11.4% in August.
- Used car and truck price increases slowed as well, to 7.2% compared to 7.8% in August.
- Housing prices increased at 6.6%, up from 6.2% in August.
- The Core Consumer Price Index, which excludes volatile food and energy costs, rose to 6.6%, higher than market expectations and the highest level since August 1982—indicating that inflationary pressures remain elevated.
Source: TradingEconomics.com/U.S. Bureau of Labor Statistics
Manufacturing
Economic activity in the manufacturing sector grew in September, with the overall economy achieving a 28th consecutive month of expansion, according to the September 2022 “Report on Business,” published by the Institute for Supply Management (ISM).
While still in growth territory at 50.9%, ISM’s Manufacturing PMI® (Purchasing Managers Index) has been trending downward since peaking at 61.2% in May 2021, and is now at its lowest level since May 2020, when it registered 43.5%.
(An index level of 50% indicates zero growth or decline in purchasing activity compared to the previous month.)
Highlights from the report included:
- Overall demand softened, with the New Orders Index returning to contraction; New Export Orders Index in contraction for a second consecutive month; Customer’s Inventories Index at a low level but as close to “about right” as it’s been since early in the pandemic; and Backlog of Orders Index approaching contraction.
- Inventories of raw materials grew at a slightly faster rate than in August, possibly due to a combination of slowing demand and improvement in supply chains.
- Price increases continued to slow, with an index of 51.7%—the lowest level since June 2020.
- Nine manufacturing industries reported growth in September, in the following order: Nonmetallic Mineral Products; Machinery; Plastics & Rubber Products; Miscellaneous Manufacturing; Apparel, Leather & Allied Products; Transportation Equipment; Food, Beverage & Tobacco Products; Computer & Electronic Products; and Electrical Equipment, Appliances & Components.
- Seven industries reported contraction: Furniture & Related Products; Textile Mills; Wood Products; Printing & Related Support Activities; Paper Products; Chemical Products; and Fabricated Metal Products.
Commodities
The following commodities saw price increases from August 2022 to September 2022.
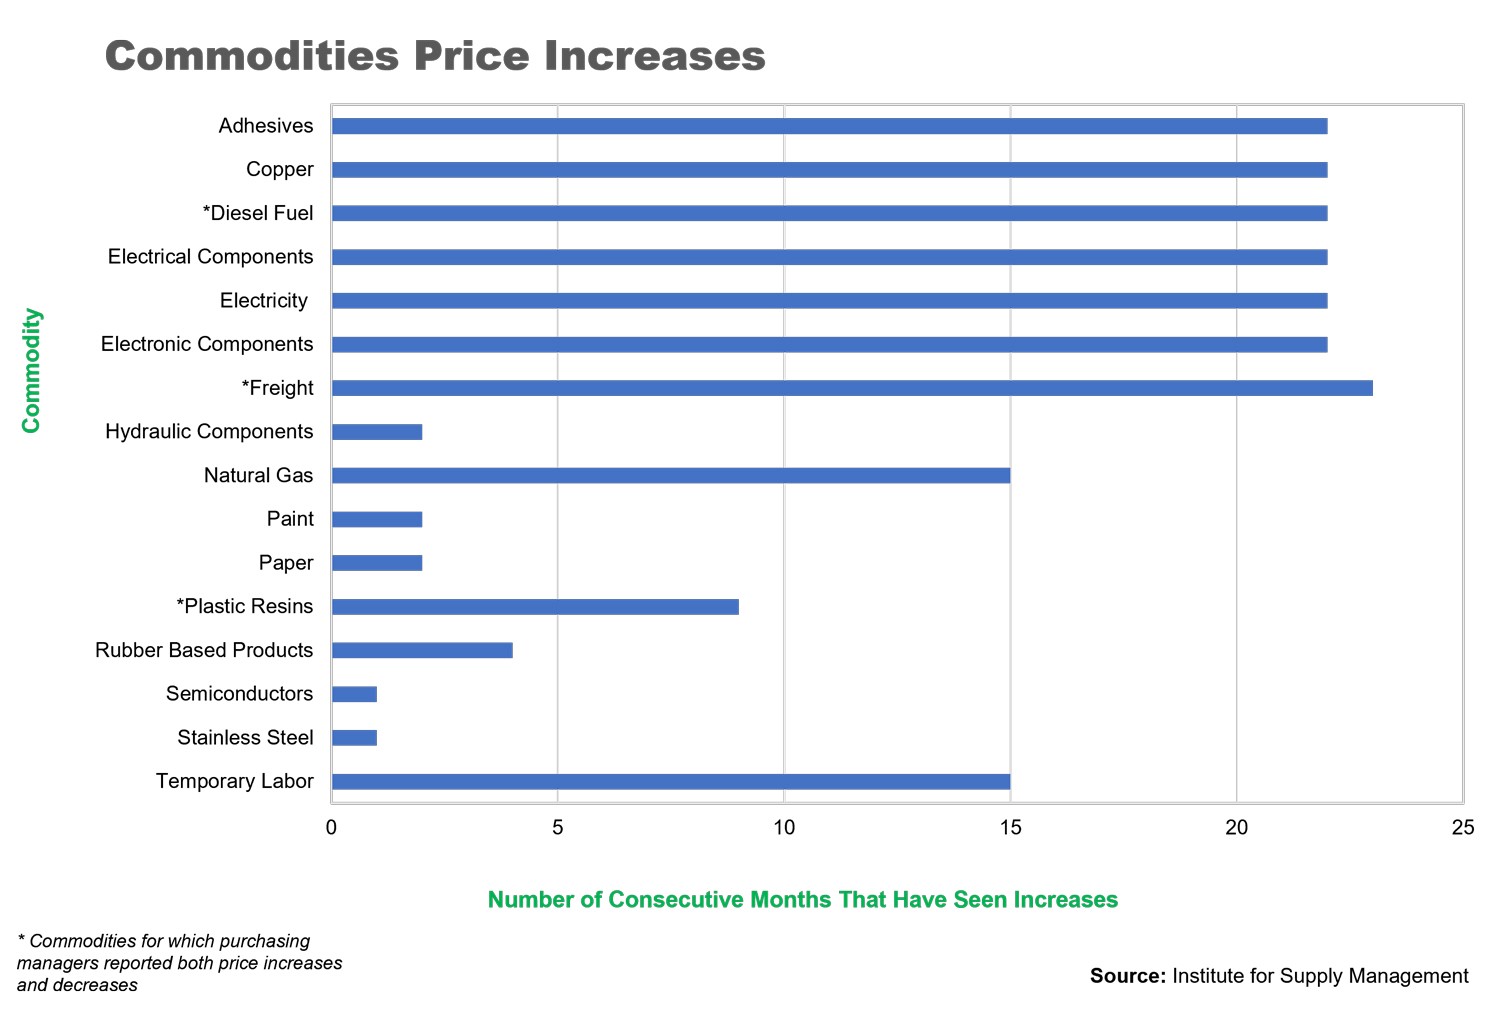 *Commodities for which purchasing managers reported both price increases and decreases
Source: Institute for Supply Management
The following commodities decreased in price from August 2022 to September 2022:
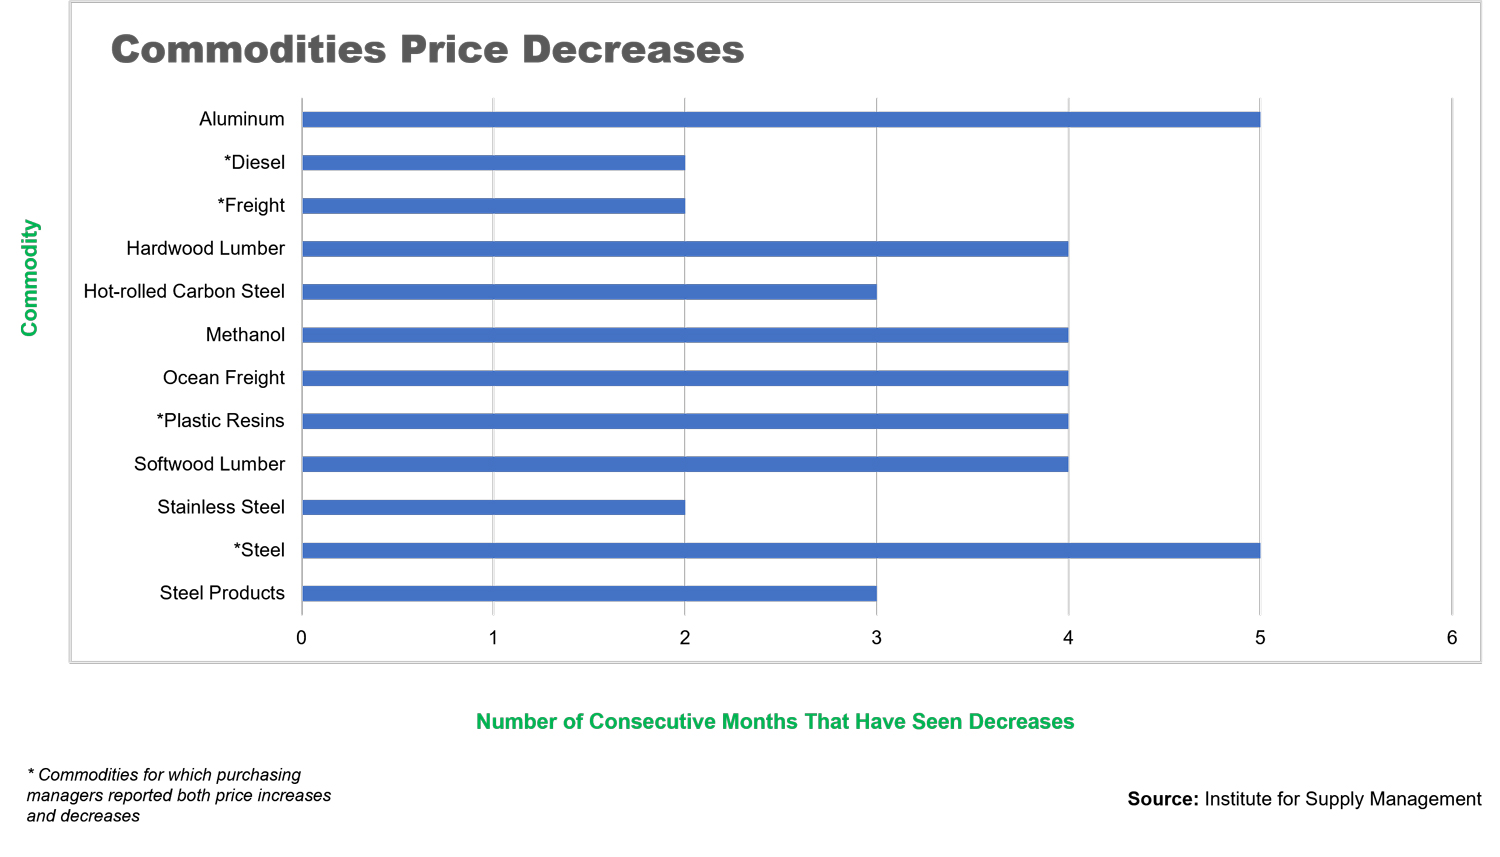
*Commodities for which purchasing managers reported both price increases and decreases
Source: Institute for Supply Management
The following commodities were reported to be in short supply:
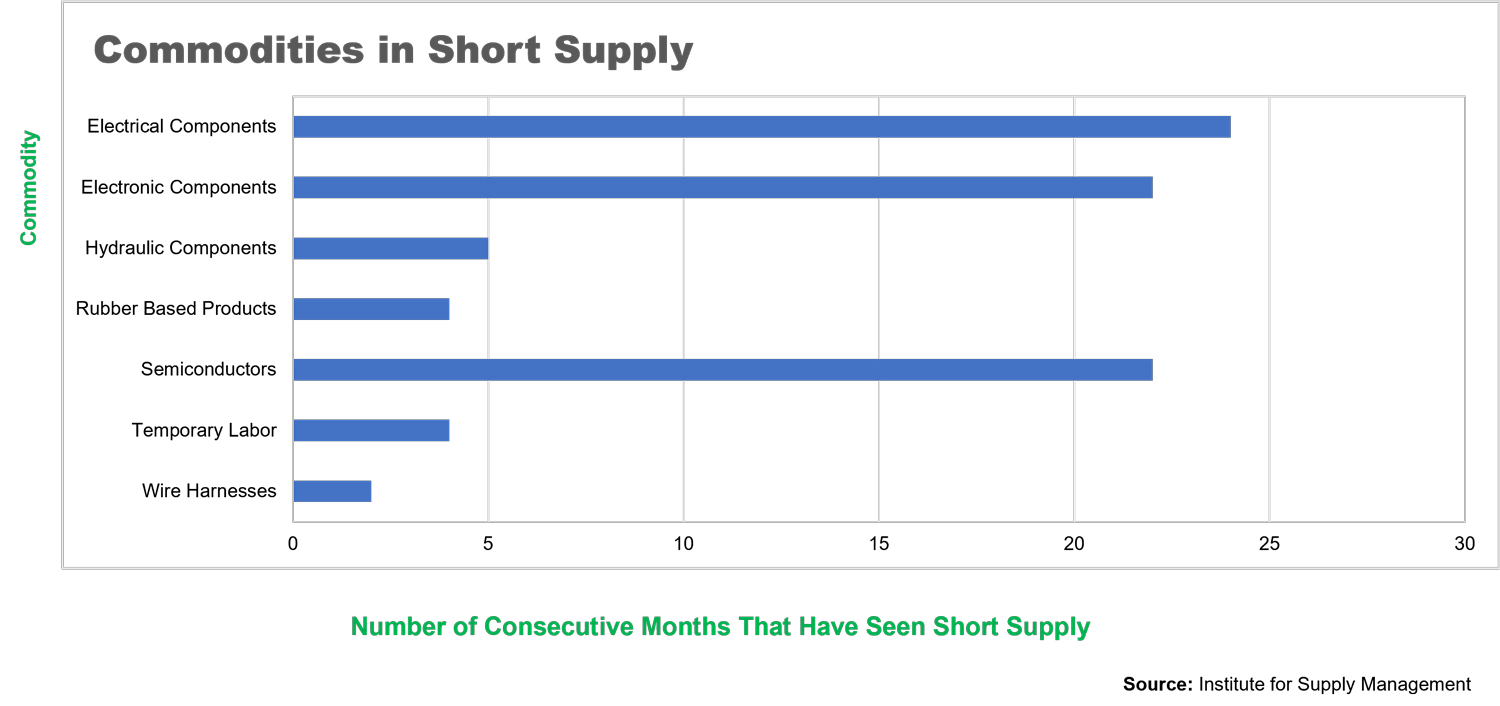
Source: Institute for Supply Management
Pulp and Paper
Total packaging papers and specialty packaging shipments remained flat in August (the most recent month for which data have been finalized), compared to the same period a year ago, according to the American Forest & Paper Association (AF&PA) August 2022 report. Year-to-date shipments also were flat compared to the previous year.
Facilities were operating at 94.4%—up 1.1 percentage points from the same period last year, with year-to-date operations flat compared to the first eight months of 2021.
Total printing-writing paper shipments decreased 5% in August compared to the same period last year, with year-to-date shipments down 2% from the same period last year.
Total inventories at pulp, paper and paperboard mills have grown steadily, up 4.5% in August compared to the all-time low reached in March 2021, according to data from the Federal Reserve. Still, those inventory levels have been shrinking steadily over the past quarter century, and while slightly elevated from pre-pandemic levels, they remain far lower than the historical average.
Source: American Forest & Paper Association
Raw Materials Costs
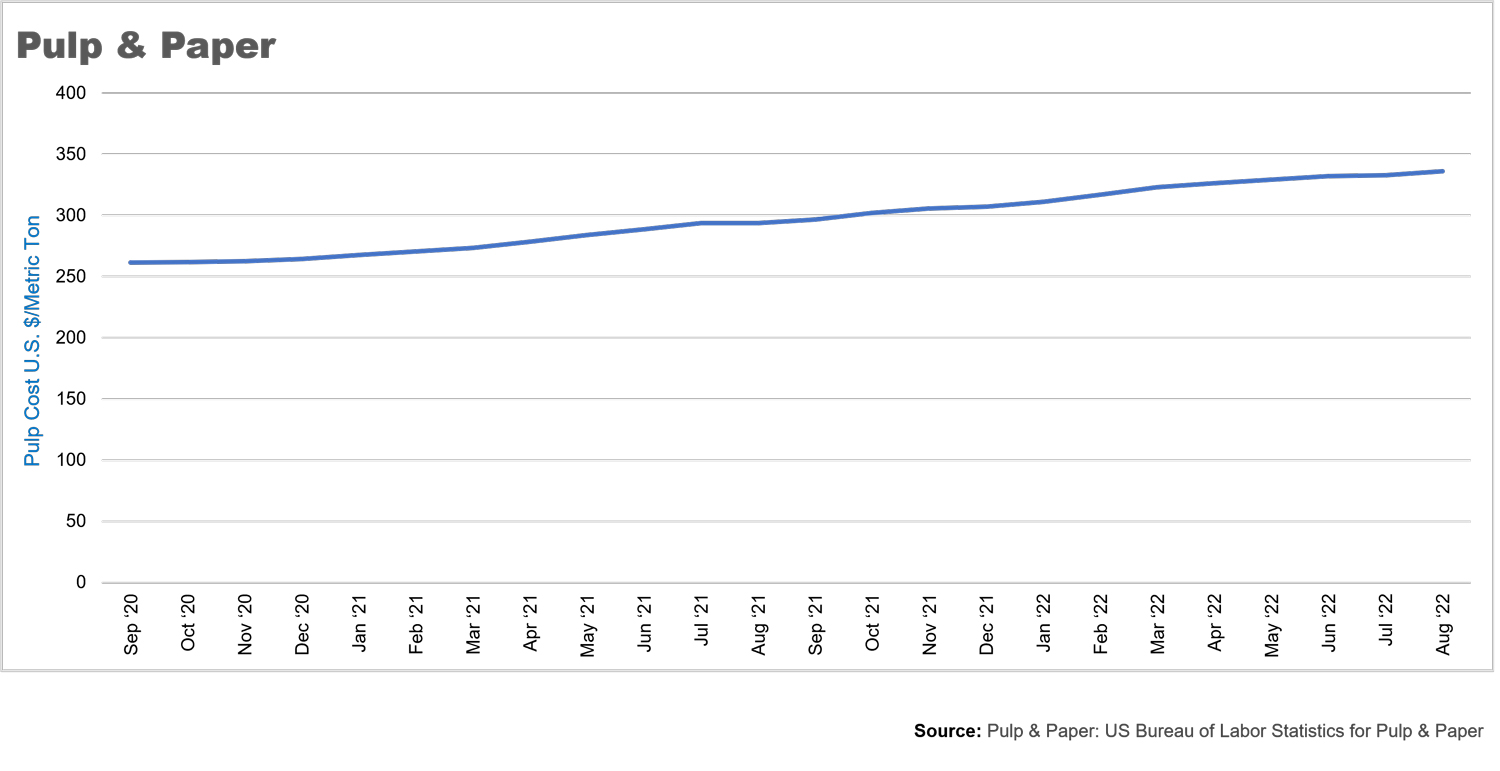
Values are an index representing price changes in the marketplace.
Source: Pulp & Paper: US Bureau of Labor Statistics for Pulp & Paper
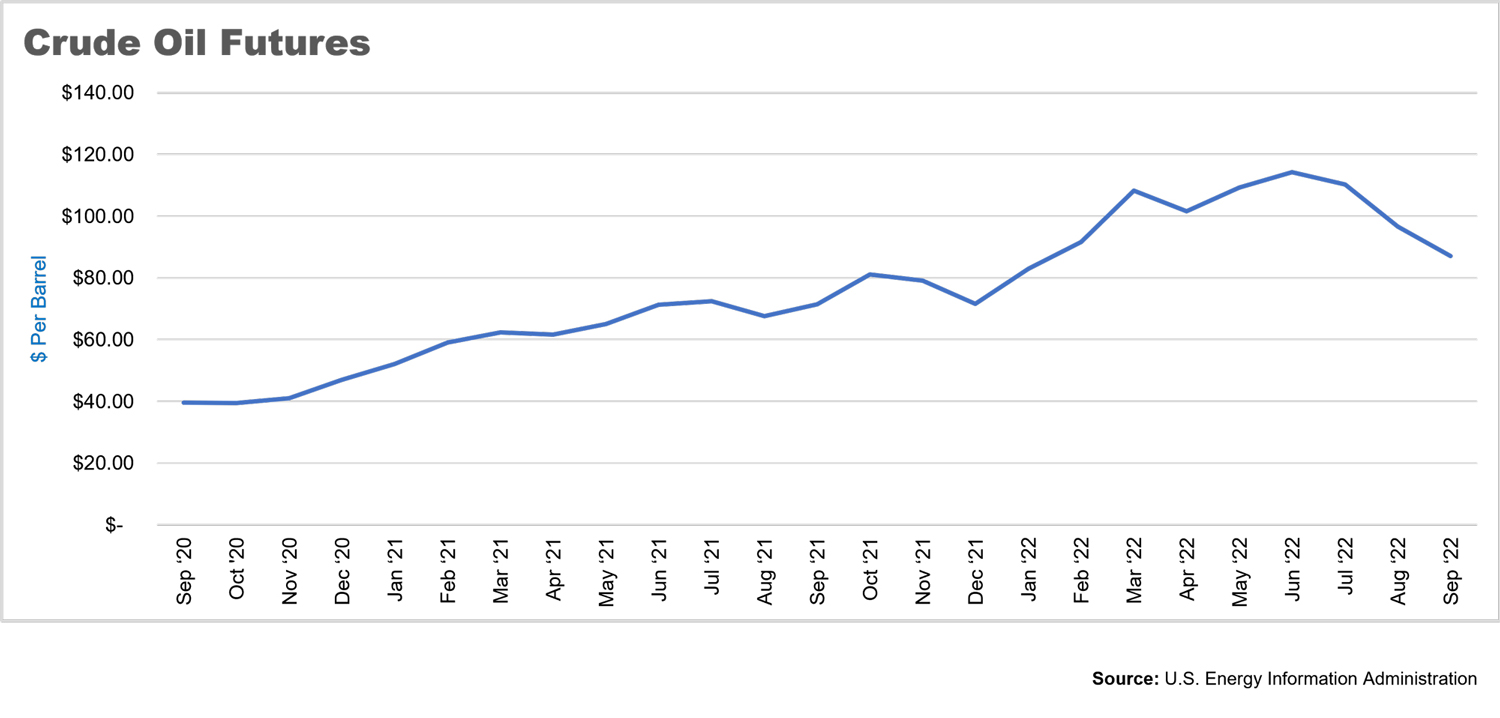
Source: U.S. Energy Information Administration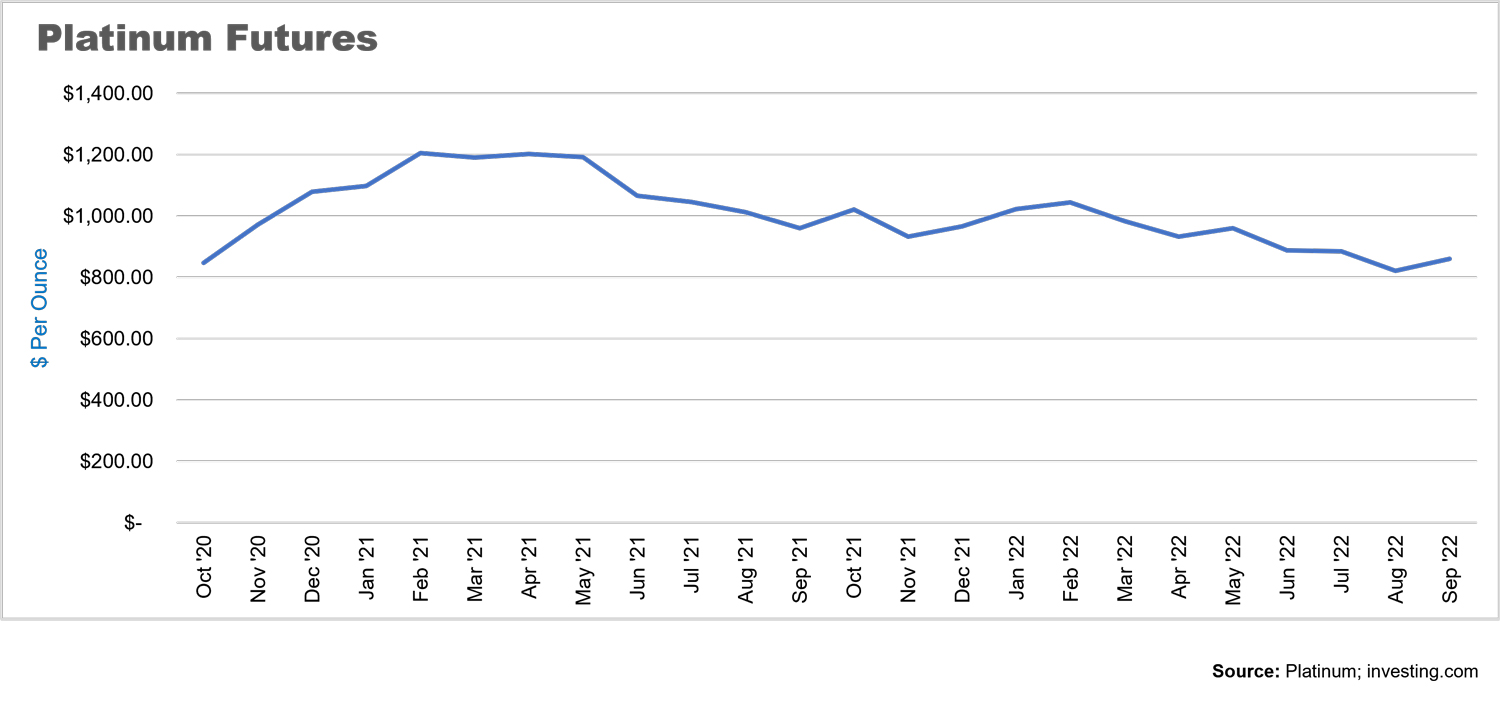
Source: Platinum: investing.com.
Diesel Fuel
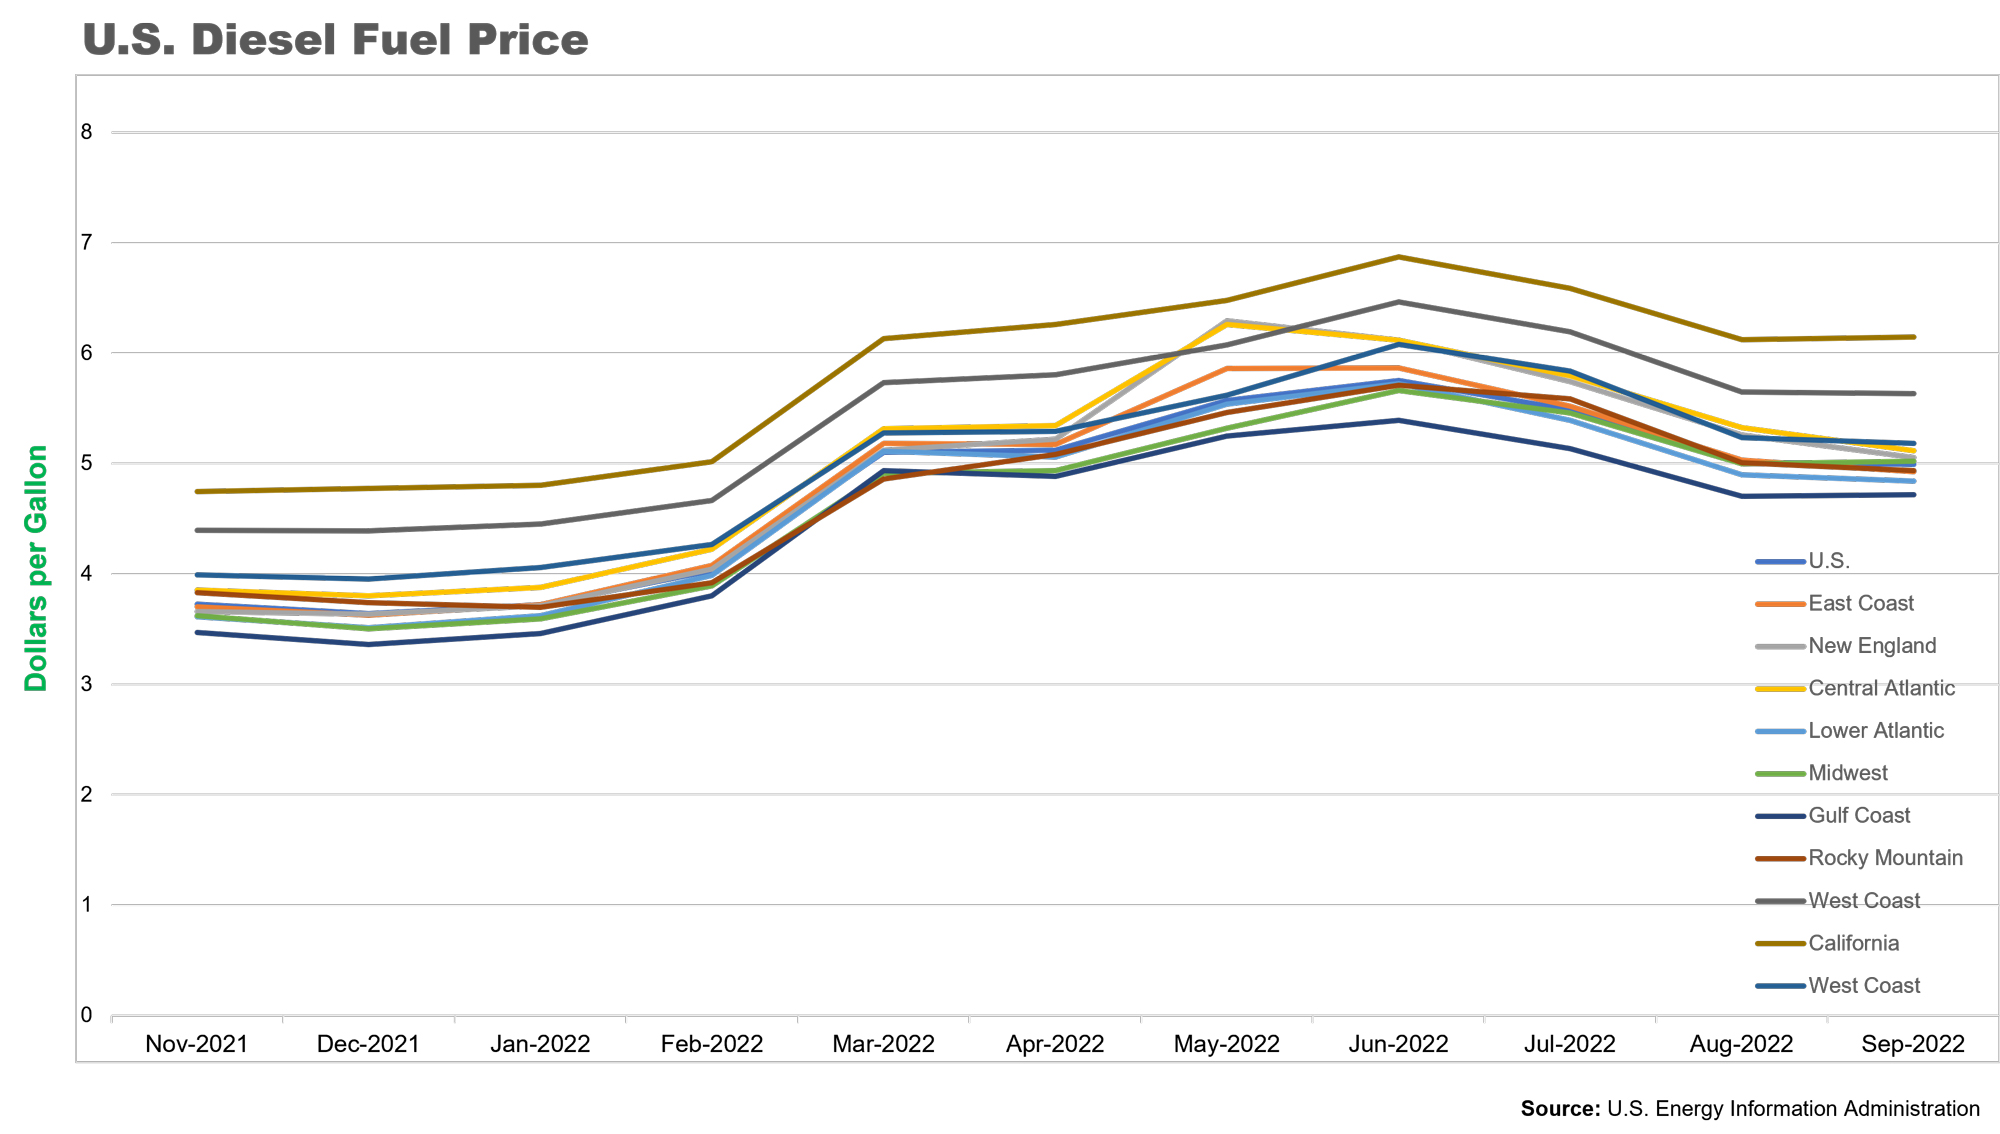
Source: Energy Information Administration
Founded in 1990, with headquarters in Cleveland, Ohio, OMNI Systems is the largest, privately owned label converter in the U.S.